My Scores
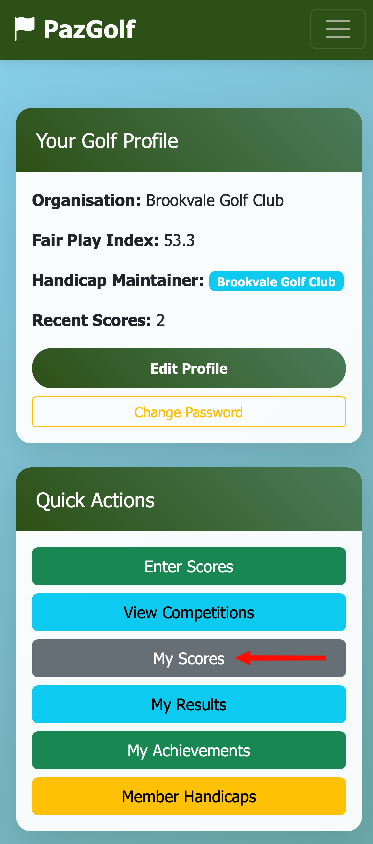
After submitting her round with Emma, Susan wants to see how it affected her handicap. From her Dashboard, she taps My Scores in the Quick Actions.
Your Score History
Tip: Rotate your phone to landscape for a better view of all the columns.
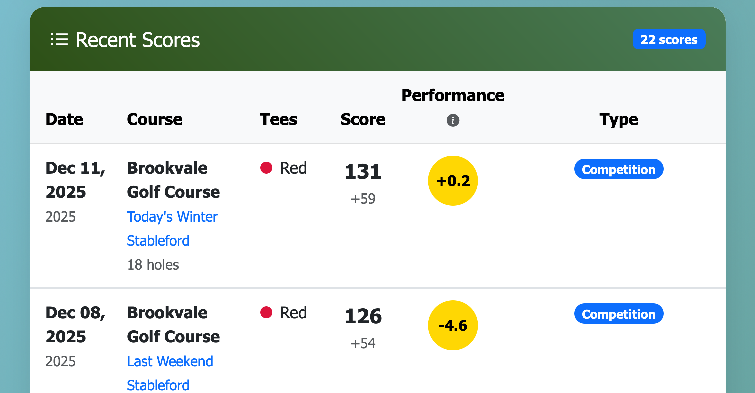
Susan can see all her recent rounds listed with key details:
- Date and course played
- Tees - which tees she played from
- Score - her adjusted score (with over/under par shown underneath)
- Performance - how she played compared to her handicap
- Type - Competition, General Play, or Casual
The most recent round appears at the top - today's Winter Stableford with Emma.
Note: The Score shown is your adjusted score, which accounts for any holes where you picked up. This may differ from your gross score. For example, Susan's 112 gross with two pickups becomes an adjusted score of 131 (pickups are recorded as net double bogey + 1 for handicap purposes).
Understanding the Counting Scores
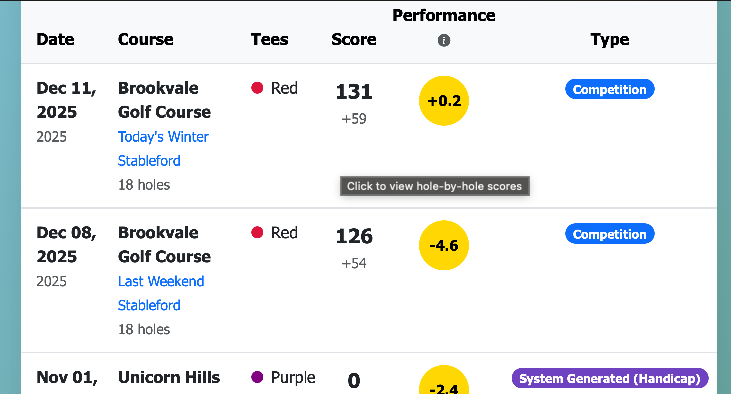
The 8 scores that currently contribute to Susan's Fair Play Index are highlighted so she can easily spot them:
- Portrait mode - the counting rows have a yellow highlight
- Landscape mode - the Performance column shows a yellow circle for counting scores
Under our industry-recognised handicap system, your FPI is calculated from your best 8 scores out of your last 20 rounds. As you play more, older scores drop off and new ones come in - your handicap is always based on recent form.
Tip: If you're working on improving your game, watch for those highlighted scores to change. When a new score pushes out an old one, you'll see your FPI adjust.
Performance Score
The Performance Score column shows how you played relative to your handicap on that day.
| Performance Score | Meaning |
|---|---|
| Negative (e.g., -3) | Played better than your handicap |
| Zero | Played exactly to your handicap |
| Positive (e.g., +5) | Played worse than your handicap |
Susan's performance score for today's round shows +2 - she played slightly worse than her handicap suggested, but that's completely normal. Golf is hard!
Over time, this column helps you spot trends. Are you consistently beating your handicap? It might come down soon. Struggling lately? Your handicap will adjust to reflect that.
Performance Graph
At the top of the page, Susan can see her Performance History visualised as a line graph.
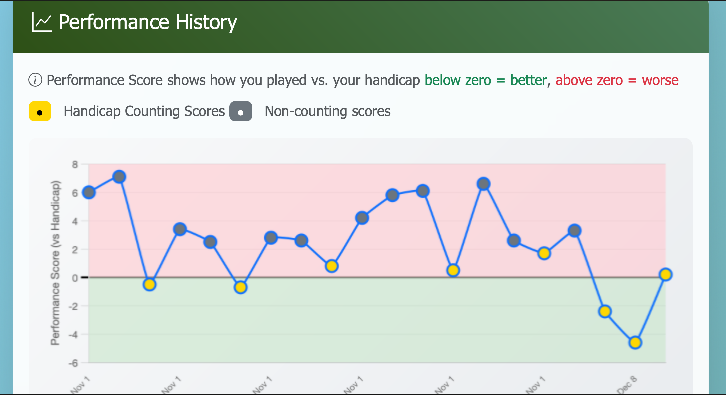
This graph gives you a quick visual snapshot of how you've been playing:
- Yellow dots - rounds that count towards your Fair Play Index (your best 8)
- Grey dots - rounds that don't currently count towards your FPI
- Green zone (below zero) - rounds where you played better than your handicap
- Pink zone (above zero) - rounds where you played worse than your handicap
- New rounds appear on the right - so you can easily track your recent form
Tap any dot to see the date and exact performance score for that round.
Susan can see at a glance how her recent rounds compare. The yellow dots scattered across the graph show which rounds are contributing to her current FPI. If she starts playing better consistently, she'd expect to see more dots dipping into the green zone on the right side.
Tip: This graph is particularly useful for spotting improvement trends. If you're working with a coach or changing your technique, watch how the right side of the graph responds over your next few rounds.
Viewing Score Details
Susan taps on today's round to see the full details.
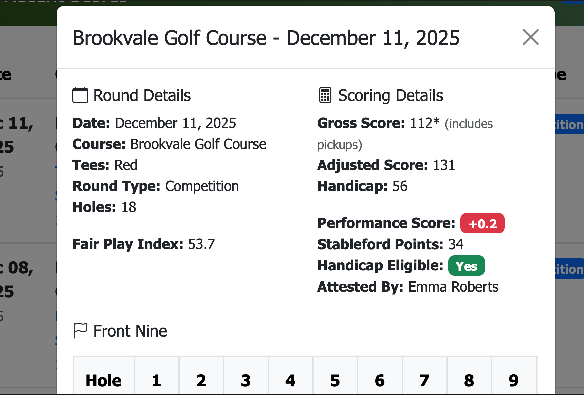
The details are shown in two columns:
Round Details:
- Date - when the round was played
- Course - Brookvale Golf Course
- Tees - Red
- Round Type - Competition
- Holes - 18
- Fair Play Index - her FPI at the time of the round
Scoring Details:
- Gross Score - 112* (the asterisk indicates pickups)
- Adjusted Score - 131 (with pickups recorded as net double bogey + 1)
- Handicap - 56 (her playing handicap for this round)
- Performance Score - +0.2 (how she played vs her handicap)
- Stableford Points - 34
- Handicap Eligible - Yes (this round counts towards her FPI)
- Attested By - Emma Roberts (her playing partner verified the score)
Scrolling down, Susan can see her hole-by-hole scores.
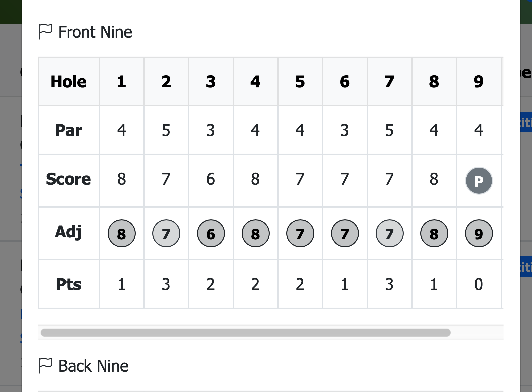
The scorecard shows Front Nine and Back Nine separately:
- Par - the par for each hole
- Score - her gross score on each hole
- Adj - her adjusted score (with pickups shown as "P")
- Pts - Stableford points earned on each hole
Tip: Rotate to landscape for a better view of all 18 holes.
This is useful for reviewing your round and spotting patterns - maybe you always struggle on the par 3s, or your back 9 is consistently stronger than your front 9.
Watching Your Fair Play Index
Back on the Dashboard, Susan checks her profile card.
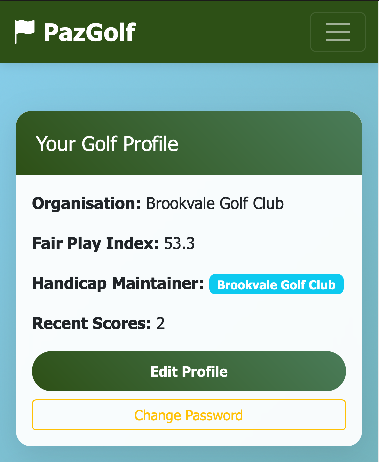
Her Fair Play Index has updated to reflect today's round - it's gone from 54.0 to 53.7. The change is small because handicaps move gradually based on multiple rounds, not just one score.
How FPI Changes
Your Fair Play Index doesn't change dramatically after a single round. Here's why:
- It's based on your best 8 of last 20 rounds
- A single good or bad round is balanced by 7 others
If Susan shoots exceptionally well in her next few rounds, she'll see her FPI gradually come down. If she has a rough patch, it will rise - but slowly, giving her time to find her form again.
Score Types
Your score history shows different types of rounds:
| Type | Counts for FPI? | Description |
|---|---|---|
| Competition | Yes | Entered in a club/society competition |
| General Play | Yes | Casual round registered for handicap |
| Casual | No | Practice or social round |
| System Generated | Yes | Created to establish your initial handicap |
Susan's round today was a Competition round, so it counts towards her FPI. If she'd just played a friendly game without entering the competition, she could have logged it as Casual - it would still appear in her history, but wouldn't affect her handicap.
About System Generated Scores: When you first join PazGolf with an existing handicap, the system creates placeholder scores to establish your handicap record. These appear on a "Virtual Course" and represent your historical playing ability. As you play real rounds, these system-generated scores will gradually be replaced by your actual scores.
Quick Reference
| What You'll See | What It Means |
|---|---|
| Yellow highlighted row | This score contributes to your FPI |
| Performance Score (negative) | You played better than your handicap |
| Performance Score (positive) | You played worse than your handicap |
| 8 highlighted scores | Your best 8 of last 20 rounds |